How does NetScope work?
NetScope is a comprehensive tool set designed to effectively monitor and manage your Internet & WAN connections. NetScope is suitable to handle small networks of less than 10 Mb per second up to large multi-site enterprise networks with 10 Gb links.
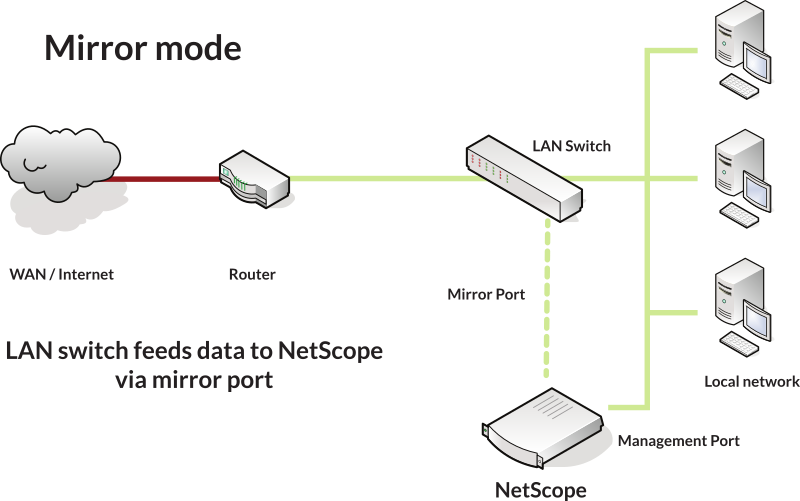
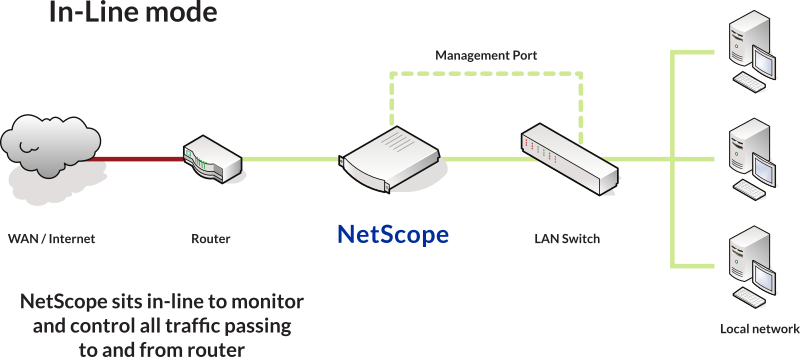
Inline or mirror, virtual or hardware
NetScope can be supplied as a physical hardware appliance, either a 1RU rack mountable device or a stand-alone tower unit. NetScope can also be run as a VMware virtual appliance (other non-VMware virtual machines are available on request).
NOTE: For QoS mode you require NetScope in-line


Internet Monitoring
Real time, per second monitoring of Internet & WAN activity
Monitor Skype, Facebook, Youtube, Twitter, BitTorrent, CRMs, ERP and many more layer 7 applications. Classify traffic by application type or site location. NetScope allows you to see and navigate through all of your Internet & WAN traffic with an intuitive graphical interface.
NetScope can categorize traffic using any number of available methods, from layer 3 to layer 7 (using deep packet inspection).
Historical traffic information is retained at a per second resolution, limited only by available storage. Demystify Internet & WAN activity with charts showing traffic broken up into useful segments. Visualize Internet & WAN health at a glance or drill down into the data to pinpoint application traffic and performance.
View Application Usage
What application view shows
- See at a glance how your mission critical applications are performing and identify bottlenecks
- Are there any Application Delays?
- Narrow down and zoom in on any aspect of your application performance over Internet
Detect application delays
Slow applications frustrate users. Seeing all aspects of application performance across the network lets you pro-actively deal with the issues. NetScope can also alert you when applications are experiencing high delays.
Detecting round trip times (delays)
- Find out which applications are delayed
- Determine how long the delays are
- See how large transfers effect delays
- Use delays to determine QoS rules
Detect undesirable use
Stop users abusing Internet access
- Detect all applications over your Internet
- See social media usage and video streaming sites
- Stop users from wasting company data
View bandwidth use
Users, groups, apps, remote sites
- View bandwidth information
- Identify bandwidth hogs
- Store usage information indefinitely
- Highlight the impact of personal use
NOTE: here we see bandwidth use for the year. Each column represents one application type, and the height of the column reflects how much bandwidth was used during time period.
Internet alerts
Predefined alerts or create your own
- Application or remote site delays
- High bandwidth use
- Link, app or site down
- Virus outbreaks
Bandwidth exceeded alerts
NOTE: NetScope will highlight the section of the chart where the alert was fired. This enables you to quickly see what traffic pattern fired the alert.
Virus Outbreak Alerts
Get instant alerts on virus outbreaks and malware infestation. Stop the spread throughout and from your organization.
- Alerts on a virus outbreak
- Alerts on malware infestation
- Block infected PCs
- Halt virus & malware propagation
Remote site or application down
NetScope watches your network and detects if any application or site drops out
- No more tedious investigation
- Quick identification
- Alerts are emailed to network administrators
Reports on Internet use
Automatically produce bandwidth usage reports
Easily produce before and after reports to prototype a new applications impact on bandwidth.
Determine emerging network trends and plan for the changing demands. With full historical data access and traffic flow you have access to all your Internet & WAN traffic data for years.
Hint: drag mouse to zoom in on any time period
See Trends in Usage
Trend lines for applications or remote sites can show the general direction of usage. Whether it is trending up, or down, can help you gage future requirements.
Predict requirements for additional applications or remote sites
With NetScope predictive analysis you can easily add applications or remote sites to your charts to see how their addition will impact Internet use.
Additional Applications
Add an additional class here
NOTE: this tool adds application traffic to the chart. It uses the max Mb/s as the ceiling value for randomly generated values. Data during work hours maxes out at the max value, data out of work hours is much less, reflecting the normal Internet use during a work cycle.
To be used as a guide only. Real values may vary.
Reduce Internet application lag
Protect bandwidth for applications that are important to you so these can operate at top speed
- Allow low priority applications full bandwidth use when important applications are not using it. Use your bandwidth effectively
- Stop VoIP calls lag caused by bandwidth hogs
- Limit the impact of large file transfers on user traffic
What is happening with this chart?
The chart above shows the CRM Internet application experiencing delays of up to 5 seconds (5000ms). This often caused by competing users and applications fighting for the right to access the Internet.
NOTE: after QoS is implemented on the CRM application the delays are reduced from up to 5 seconds down to no more than 100ms (0.1 seconds). This means that no matter what other traffic is using the Internet link, the CRM software is guaranteed priority.
Protect some web traffic and block others
Guarantee low latencies to important websites
Some of the bigger websites use content deliver networks (CDNs) to distribute their content. This makes it very difficult to monitor, prioritize and block these websites based purely on domain name. NetScope uses deep packet inspection to determine the remote website traffic. This allows monitoring, prioritization and blocking of websites that would otherwise require hundreds of rules.
- Important websites should get priority
- Blocking any undesirable website
- Block social media sites during work hours
- Rate limit video streaming like YouTube
- Allow groups like marketing full access to the web
- Restrict access other groups
- Deep packet inspection tracks multi-domain websites